2024Financial Study Results: Effective Management Drives Superior Profits
The 2024 Comparative Financial and Operations Analysis for home builders marks the thirty-second consecutive year Shinn Group has conducted the study. Throughout the years, we have accumulated a landmark historical record of home building companies’ financial and operational performance: the challenges, the changes, the adjustments, the improvements, the victories, the defeats and the comebacks. I am honored to have gained your trust to access the most sensitive information from your companies. I thank all of you for your continued participation and support. This year marks my final involvement. I am passing the torch to Emma Jane Wildermuth to continue this important research study documenting the financial and operational performance of our clients and followers. We are very proud of our clients and followers, who throughout the years have demonstrated a commitment to excellence in operations, elevating their management systems and practices to achieve superior quality, customer satisfaction and profitability.
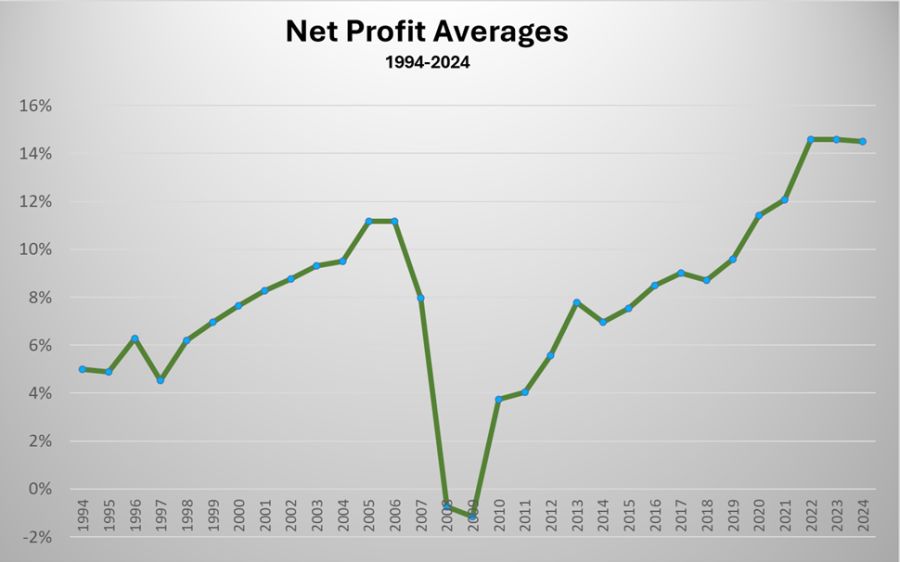
The Net Profit Averages chart shows the trajectory of the industry’s profitability from 1994 to 2024. Much like 2023, 2024 was a year of anticipation and uncertainty, requiring a watchful eye and continued adjustments to sales, construction and operational strategies. The builders in our sample group remained vigilant, responding timely to the multiple changes occurring during the year. As a result, profitability was mostly unchanged from 14.58 percent in 2023 to 14.52 percent in 2024. Participants showed an improvement in gross profit of 0.15 percent, along with a small increase in operating expenses of 0.21 percent resulting in a small loss in profitability of 0.06 percent. From 2023 to 2024, the average gross revenue declined slightly by 0.5 percent. Prices declined by about 6 percent, while number of units sold increased by 5 percent, neutralizing any significant change in average gross revenue. The significant change between 2023 and 2024 was the decrease in the average sales price, indicative of discounting and/or buyers looking for smaller, lower-priced homes to compensate for high interest rates.
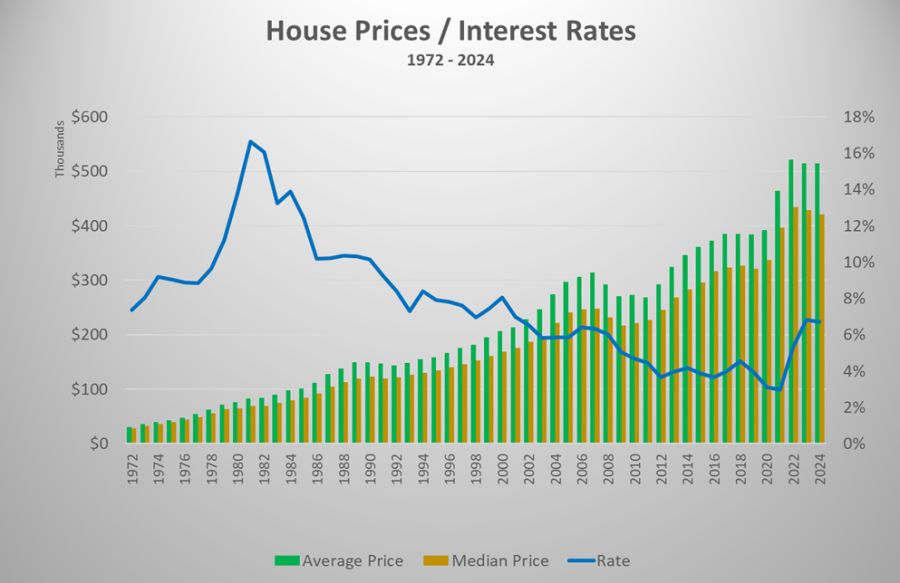
The House Prices / Interest Rates chart illustrates average sales prices and interest rates from 1972 to 2024, showing the trajectory and impact of interest rates on the housing market. The advantage the housing market has had during the present cycle versus what happened in the 2007-2009 cycle has been the lack of new homes inventory and the high demand for housing in the marketplace, coupled with a lack of existing homes for sale. The combination of these factors allowed builders to continue to increase prices and absorb increases in discounts and concessions for buyers during 2023 and 2024. However, during 2025, in anticipation of decreases in interest rates that did not materialize, new homes inventory expanded to almost 10 months of supply. The increase in inventory demanded higher discounts and concessions to motivate buyers and close sales. Therefore, we are anticipating lower margins and lower profits in 2025.
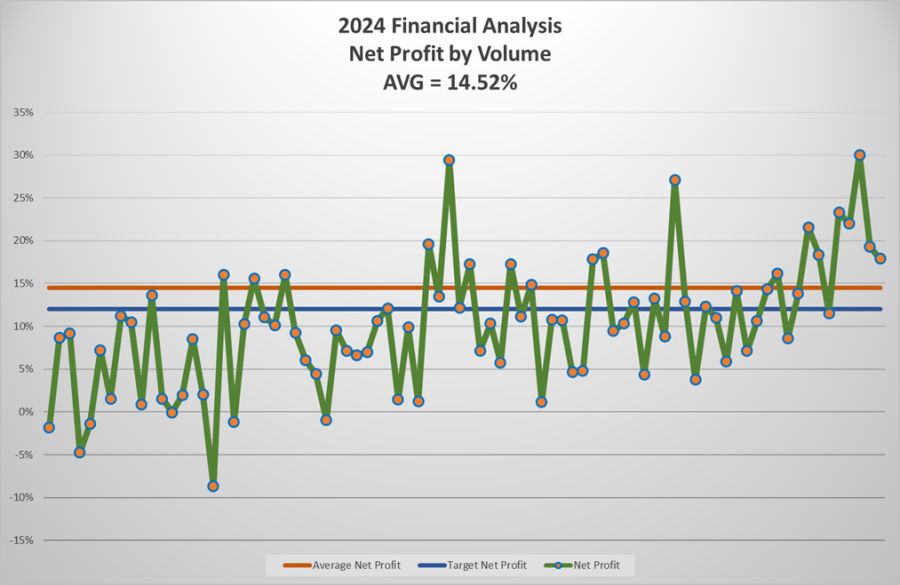
As indicated in the Net Profit by Volume chart, and analysis of results over the last five years, smaller builders appear to be less prepared and have less resources available to help them overcome challenges during industry downturns. Therefore, they need to be better prepared and have contingency plans in place to adjust more rapidly and efficiently to economic decline. However, at all sizes, there are builders achieving superior profits of over 10 percent. Repeating what we say year after year, size is not a requirement to achieve superior profits. Effective management processes are the key driver of superior profits.
During 2024, cost increases began to moderate due to the sluggish demand for housing. Cost containment and time management remained critical during 2024 and will continue to be so during 2025. The rise in interest rates created pressure on affordability, increasing monthly payments as much as $1,000 per month on a $450,000 home. In contrast, during the last decade, interest rate decreases subsidized home sales price increases by reducing monthly payments due to decreases in the interest rate. Today, reducing sales prices is a desirable strategy to stabilize affordability and maintain sales velocity. However, in many instances, new product will have to be designed to meet the constraints set by the buyers purchasing power.
In spite of present challenges, we continue to support the position that the decade of the 2020s will be a record profit performance time for the home building industry. As interest rates begin to decrease and stabilize, sales volumes will begin to return to normal with profitability likely to increase.
This study is not representative of the home building industry as a whole. The companies participating in the study are Shinn Group consulting clients and/or have attended at least one of the management seminars we offer. We want to emphasize that the identity of every participant is held in the strictest of confidence.
Fifty percent of the participants reported revenues under $64M, 25 percent reported revenues between $64M and $114M and 25 percent reported revenues from $114M to $415M. Only 27 percent of the participating companies reported any growth during 2024; 20 percent of the companies reported volume declines compared to 78 percent in 2023. The growth projections for 2025 have a broader range than in years past, ranging from -25 percent to over 100 percent. Growth projections for 2024 were impacted by anticipation of interest rate decreases. During 2024, interest rates settled with only minor movement up or down on mortgage rates. As the reality of high interest rates settled in, builders developed programs and incentives to help maintain sales velocity.
Although the forecasted increased demand for this decade allows room for price increases, affordability threatened by mortgage rates will limit the ability to raise sales prices. Because construction cost is the main contributor to gross profit or margin, it needs to be monitored on all fronts, starting with design, specifications, selections, purchasing processes, negotiations and construction efficiencies. The spectrum is much wider than simply negotiating prices with suppliers and trades. It is important to first understand the buyers, including their wants and what they are willing to pay for or can afford. Carefully managing design, selection of materials, negotiations, processes, waste control and speed of construction, as well as other operational elements, can help decrease direct construction cost. It is a team effort within each company including every department: sales, design, back office, field management, accounting and warranty. In other words, every employee in the company plays a role in this effort and must contribute to the common goal.
The universal conclusion year after year is that to achieve superior net profits (before taxes), the company needs to achieve superior gross profits (sales minus lot cost and direct construction cost). However, superior gross profits do not guarantee superior net profits. The volume, area of the country and the average price of homes do not have much bearing on achieving superior profits. The analysis by size, region and price point presented in the study supports our conclusion. Our observations indicate the prevalent reason superior builders maintain superior profits, year after year, is excellence in operational processes and procedures and discipline during execution, making them not only profitable, but also consistent and reliable.
It has been an incredible journey for me to work on this study for 32 years. It has been a pleasure, and the process has been an incredible learning and growing experience for me. It is my hope that over the years, this study has provided guidance and direction to help improve your results, not only in profits but also in quality, customer satisfaction and in an interior sense of accomplishment and contribution to your family, clients, community, and self-determination. In passing the torch to Emma Jane, I know she will continue to expand and improve the study, bringing it to a higher level using the new tools technology is now affording us.
For an in-depth look at the results of the study,
download the order form and order your copy of the 2024 Comparative Financial and Operations Analysis today.
Order your copy.


