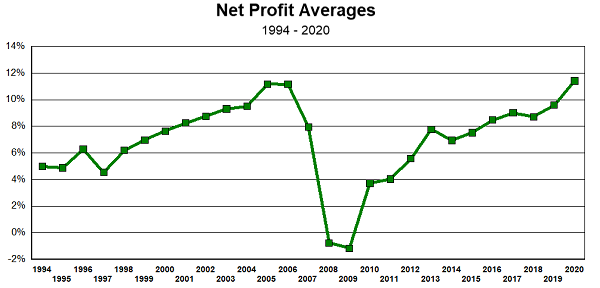
An impressive jump in profitability for home builders is among the compelling results of the 2020 Financial and Operations Analysis. The 2020 net income of 11.4 percent is the highest on record since the industry started tracking net income in the early ‘70s and The Shinn Group started the annual study in 1994. Net income in 2020 exceeded the net income achieved in 2006, our banner year, by 0.25 percent and exceeded 2019 net income by 1.8 percent.

The Profitability Comparative Performance chart shows how the two main components of profitability—gross profit and operating expenses—impact the results. Gross profit is a reflection of lot cost and direct construction cost. To arrive at gross profit, deduct from revenues the lot cost and the cost to build the house (and ONLY the cost of sticks and bricks and labor to install them). The second component is operating expenses which include the indirect construction cost (the cost of managing the construction operations), financing expenses, sales and marketing expenses (including all expenses to promote, create and manage the sales), and general and administrative expenses. In other words, how much it costs to run and manage the business. To be able to analyze, understand, establish accountability, and create strategies, each category needs to include only the cost and expenses pertaining to the specific category.
Take a look at the components to understand the dynamics occurring in 2006 versus 2020. In 2006, the industry performed at a gross profit of 29.7 percent and operating expenses of 18.5 percent for a net profit of 11.2 percent. In 2020, the gross profit percent was 25.9 with operating expenses at 14.5 for a net profit of 11.4 percent.
Under most economic conditions, the profit ratio in 2006 is more sustainable since gross profit is less susceptible to small variations in volume. Operating expenses are very susceptible to volume changes as they are mostly fixed in nature and changes in volume will not necessarily decrease or increase the dollar amount, but will affect the performance ratio. Obviously, after 2006, we had a total collapse of the industry, creating price discounting to sustain volume at the expense of decreases in gross profit. During 2020, we saw an increase in sales volume extending into 2021, together with large increases in materials and labor cost, thus requiring a balancing act between increasing the sales price of the homes and cost containment. Present conditions have created a volatile market requiring fast reactions to be able to maintain the desirable level of profits.
The two components essential to achieving good profitability are the cost of the product, including the lot (cost of sales) and the cost of running and managing the company (operating expenses). To maximize the return on the product, you need to start with good market research, land position, design, specifications, and negotiations (to name a few), with the objective of maximizing value and minimizing cost. The second component is the management of resources to achieve efficiencies and effectiveness through systems, processes and procedures.
To reinforce this concept, take a look at the next two charts showing high-performance builders and low-performance builders. The charts illustrate the impact the two components—cost of the product and efficiency of operations—have on the profitability of the company and the interrelationship between the two components. It is also important to note that in spite of the instructions to not include any operating expenses in the cost of sales category, some low-profit builders might have included some in their cost of sales. In analyzing the results, convoluting the categories makes it difficult to identify the problem areas.

In 2020, the industry functioned with low operating expenses. Increases in revenue will most likely require increases in production and office staff. Since staff increases are stair steps instead of proportional to increases in volume, it will not be unexpected to see in 2021 an increase in the operating expenses ratio, possibly creating a decrease in net income unless higher prices can increase the gross profit ratio.
Historically, builder size and geographical location have not been a determinant of profitability. However, in 2020, both size and location made a difference in the profit performance of the builders as shown in the chart of profitability by size.

Unlike past performances, the first half of the builders which represent volumes of less than $50M performed under the target, with only one company reaching the target.
The same is true of the builders in states where construction was not considered an essential industry. Even though we do have some good profitability from builders in Michigan and Pennsylvania, builders forced to close field operations lost profitability as compared to the prior year.
At the start of the pandemic, when sales came to a screeching halt, staff got disbursed, and total uncertainty was on the horizon, many builders focused on reviewing their processes and procedures. The result of this effort is evident in the operational section of the report where all operational procedures show a larger percentage of implementation across the board in 2020 when compared to 2019.
For an in-depth look at the results of the study, click here to order your copy of the 2020 Comparative Financial and Operations Analysis.